How to Conduct RFM Analysis to Improve Your Business Strategy

RFM analysis is a marketing technique used to analyze and categorize customers based on their past purchase behavior. The acronym RFM stands for Recency, Frequency, and Monetary Value, which are the three key factors used to determine a customer’s value to a business.
RFM analysis involves segmenting customers into groups based on these three factors, typically assigning a score to each factor and then combining them into an overall score or ranking. This enables businesses to identify their most valuable customers and tailor marketing efforts to target them more effectively. RFM analysis can also help identify customers who are at risk of churning or leaving a business, allowing the business to take proactive steps to retain them.
- Collect data: Gather information on customer transactions, including purchase dates, amounts, and order frequencies.
- Determine the time range: Decide on the timeframe for analysis. This depends on the frequency of purchases and the nature of your business. For example, if you sell seasonal products, you may want to analyze data for the past year.
- Calculate Recency: Determine how recently each customer has made a purchase by calculating the number of days between their most recent purchase and the end date of the analysis time frame. Assign a score to each customer based on their recency, with higher scores indicating more recent purchases.
- Calculate Frequency: Determine how often each customer makes purchases by calculating the total number of purchases they have made within the analysis time frame. Assign a score to each customer based on their frequency, with higher scores indicating more frequent purchases.
- Calculate Monetary Value: Determine the total amount of money each customer has spent on purchases within the analysis time frame. Assign a score to each customer based on their monetary value, with higher scores indicating higher spending.
- Combine scores: Combine the scores for each factor into an overall RFM score. You can do this by adding the scores for each factor together to create a total score, or by using a weighted average to give more weight to certain factors depending on the nature of your business.
- Segment customers: Segment customers into groups based on their RFM scores. For example, you can group customers with an RFM score of 15 as your most valuable customers, and those with an RFM score of 3 as your least valuable customers.
- Analyze results: Analyze the results of your RFM analysis to gain insights into customer behavior and identify opportunities for improving your marketing strategies. For instance, you may discover that your most valuable customers tend to make larger purchases on weekdays, while your least valuable customers tend to make smaller purchases on weekends. You can then adjust your marketing campaigns to target these customer segments more effectively.
I have added the link to the dataset that I used so that you can also work with it. It has 8 columns transactionno, date, productno, productname, price, quantity, customerno, country.

We will be using SQL queries to do the analysis. And our time period will be from June 2018 to May 2019.
To calculate the recency score we need the last purchase date of the customers of a given period. To calculate that we can use this query :
 SELECT
    customerno,
    MAX(date) AS last_purchase_date
  FROM sales_transaction
  WHERE date  BETWEEN CAST('2018-06-01' AS DATE) AND CAST("2019-05-31" AS DATE)
  GROUP BY customerno
RFM Calculation:
WITH last_purchase_by_customer AS (
  SELECT
    customerno,
    MAX(date) AS last_purchase_date
  FROM sales_transaction
  WHERE date  BETWEEN CAST('2018-06-01' AS DATE) AND CAST("2019-05-31" AS DATE)
  GROUP BY customerno
),
rfm_scores AS (
  SELECT
    a.customerno,
    date_diff(CAST("2018-12-31" as DATE), MAX(last_purchase_date),"DAY" ) AS recency_score,
    COUNT(*) AS frequency_score,
    SUM(price) AS monetary_score,
    (date_diff(CAST("2018-12-31" as DATE), MAX(last_purchase_date),"DAY") + COUNT(*) + SUM(price)) AS rfm_score
  FROM sales_transaction a
  LEFT JOIN
      last_purchase_by_customer b
  ON  a.customerno = b.customerno
  WHERE date BETWEEN CAST('2018-06-01' AS DATE) AND CAST("2019-05-31" AS DATE)
  GROUP BY a.customerno
)
SELECT
  customerno,
  recency_score,
  frequency_score,
  monetary_score,
  rfm_score,
  CASE
    WHEN (recency_score >= 4 AND frequency_score >= 4 AND monetary_score >= 4) THEN 'Champions'
    WHEN (recency_score >= 4 AND frequency_score >= 4 AND monetary_score < 4) THEN 'Potential Loyalists'
    WHEN (recency_score >= 4 AND frequency_score < 4 AND monetary_score >= 4) THEN 'Recent Customers'
    WHEN (recency_score >= 4 AND frequency_score < 4 AND monetary_score < 4) THEN 'Promising'
    WHEN (recency_score < 4 AND frequency_score >= 4 AND monetary_score >= 4) THEN 'Loyal Customers'
    WHEN (recency_score < 4 AND frequency_score >= 4 AND monetary_score < 4) THEN 'Need Attention'
    WHEN (recency_score < 4 AND frequency_score < 4 AND monetary_score >= 4) THEN 'About to Sleep'
    ELSE 'At Risk'
  END AS rfm_segment
FROM rfm_scores;
Let’s take a closer look at the query. The query is divided into three parts:
- The first part of the query selects the latest purchase date for each customer.
- The second part of the query calculates the RFM scores for each customer based on their recency, frequency, and monetary values.
- The third part of the query assigns a segment to each customer based on their RFM scores.
The RFM scores are calculated as follows:
- Recency Score: This score measures how recently a customer made a purchase. The more recent the purchase, the higher the score. The score is calculated by subtracting the last purchase date from a fixed date (December 31, 2018 in this case).
- Frequency Score: This score measures how often a customer made a purchase. The more purchases a customer made, the higher the score.
- Monetary Score: This score measures how much money a customer spent on purchases. The more money a customer spent, the higher the score.
RFM Categories
The RFM categories are typically created based on percentiles or quartiles of the RFM scores. Here are some common categories:
- Champions: Customers who have made recent, frequent, and high-value purchases
- Loyal customers: Customers who make frequent purchases and have a high lifetime value
- Potential loyalists: Customers who have made recent, high-value purchases but haven’t yet established a pattern of frequent purchasing
- Promising: Customers who have made recent, frequent purchases but haven’t yet spent much
- Recent customers: Customers who have made a recent purchase but haven’t yet established a pattern of frequent purchasing or high spending
- Need attention: Customers who used to make frequent purchases but haven’t made one recently
- About to sleep: Customers who haven’t made a purchase recently and haven’t established a pattern of frequent purchasing or high spending
- At risk: Customers who used to make frequent purchases and have spent a lot in the past, but haven’t made a purchase recently
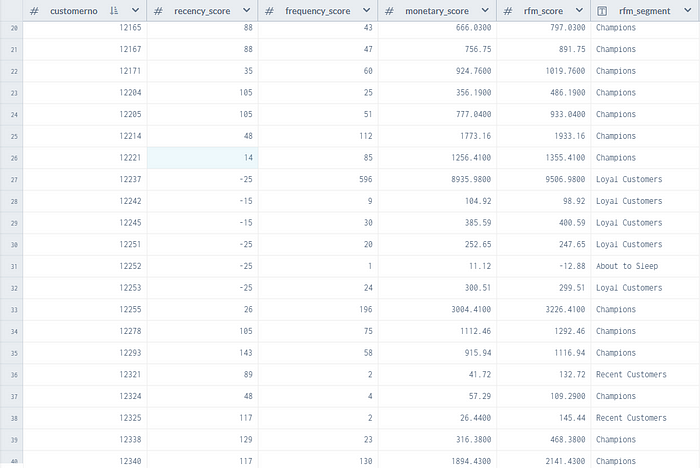
The final output of the query is a table that lists each customer with their RFM scores and segment. The segment is determined based on the customer’s RFM scores and helps to identify different types of customers based on their behavior.
Here is the output dataset link
By analyzing these metrics, businesses can create customer segments that are based on behavior and help tailor marketing and retention strategies to each segment.
Once the RFM scores are calculated, businesses can segment their customers and tailor their marketing efforts accordingly.
Business Use of RFM Analysis:
- Customer segmentation: By grouping customers based on their RFM scores, businesses can identify different customer segments and tailor their marketing strategies accordingly. For example, they may want to offer special discounts to customers who have not made a purchase in a while (low recency score) but have made high-value purchases in the past (high monetary score) to encourage them to return.
- Product cross-selling: RFM analysis can help businesses identify which products are commonly purchased together, allowing them to create targeted product bundles or recommend complementary products to customers. For example, if customers who purchase high-end cameras tend to also purchase tripods and camera bags, a business may want to bundle these products together or recommend them to customers who have purchased the camera but not the accessories.
- Churn prediction: A decline in a customer’s RFM score may indicate that they are at risk of churning (i.e., no longer doing business with the company). By monitoring changes in RFM scores over time, businesses can identify which customers are at risk of churning and take proactive steps to prevent it. For example, they may want to offer personalized discounts or rewards to these customers to encourage them to continue doing business with the company.
- Marketing campaign effectiveness: RFM analysis can help businesses evaluate the effectiveness of their marketing campaigns by measuring changes in RFM scores over time. If a marketing campaign is successful, it should result in higher RFM scores for the targeted customers. By tracking RFM scores before and after a campaign, businesses can determine which campaigns are most effective and adjust their strategies accordingly.
Conclusion
RFM analysis is a powerful technique for understanding customer behavior and segmenting customers based on their value to your business. By calculating scores for recency, frequency, and monetary value, you can gain insights into which customers are most valuable and tailor your marketing efforts to target them more effectively.
Here are some useful links to help you learn more about RFM analysis and how to use it in your business:
- What Is Recency, Frequency, Monetary Value (RFM) in Marketing?https://www.investopedia.com/terms/r/rfm-recency-frequency-monetary-value.asp
- Effective Customer Segmentation through RFM Analysishttps://www.omniconvert.com/blog/rfm-analysis/
- How to Use RFM Segmentation to Understand Audience?
https://www.verfacto.com/blog/customer-segmentation/rfm/